Football Twitter nerd stuff

Yeah - my understanding (and I could be completely wrong) is that Opta uses the entire league (or some very large, broad sample) to establish baseline/good xG and xA and then apply it… that way you get meaningful comparisons and interesting trends over long period… games are useless for virtually any football stat b/c of the nature of the game…

I mean we look at things that have averages of 1.5 in a game that is 20 field players where one player is involved “directly” in play that affects stats like 3-5% maybe.

Anyway, I tend to take the view that these things can be useful in the right context… I can see why someone might find them virtually useless though.

Since I have a deep background in stats (I suspect you do too) but have mostly applied in business setting (where it is massively noisy), i am more willing to take a semi-scientific approach.

Caveat…we did just play Liverpool, and Burnley also pressed us pretty high up the pitch. Still doesn’t make good reading but it is early days…

1 Like

Yeah its not surprising… we don’t play that well out of the back yet we try it repeatedly and we have played two very high pressing teams, including one of the best in the world at that game.

I reckon if you look at Pool and us on that chart, our one game with them accounts for a lot of that… I can recall at least 2 absolutely braindead clearances from our players right to Pool players in the middle.

Eyeball test on those charts show me that they are so good they double up half the league and we are so bad we double up half the league (in the wrong way).

Regression to the mean will work itself out, but this has been a weakness. Especially if we are missing our main wide backs and playing a brand new CB. At least Luiz has it in his locker to do those firm, penetrating passes or the long ball. And of course with Xhaka needing 4 seconds to figure out what is going on around him and turn every time, well…

1 Like

Analysis of Arsenal’s first-half against Liverpool.

https://statsbomb.com/2019/08/anatomy-of-a-half/

"…Only four times in 2018-19 did a team reach the half time point having allowed 15 or more shots. Three of those matches were small teams flailing around against Manchester City and the other, oddly, was Newcastle versus Huddersfield. All this brings to the boil a personal frustration of mine. Expected goals is a useful tool in many aspects of analysis, but it’s not the only one. What actually happened in this half of football over and above the modelled value of the chances?

To allow 15 shots of any kind in a half is a clear sign that a defensive plan isn’t working…"

1 Like

That’s a great article, here’s a couple more gems.

They let Liverpool push onto their full-backs and this made outlet balls difficult to complete.

Liverpool had shown a potential defensive weakness in their first two games in the Premier League this season. Norwich scored and hit six shots on target from 13 with 1.1 xG, while Southampton also scored and landed 1.6 xG from their 11 shots. Unai Emery’s gameplan felt like one which respected the Liverpool team of last season , the team that was firing on all cylinders when demolishing his team 5-1, not the team that hadn’t quite clicked into gear in 2019-20. They afforded Liverpool too much respect while negating their own strength–their attacking prowess–and ended up on the wrong end of a one sided match regardless.

1 Like

Nerds

2 Likes

Emery’s performance didn’t pass the analytics test, nor did it pass the eye test for the savants like us who understand the game well. That cowardly performance away didn’t fool us, sorry homeboy.

1 Like

:joy:

Come to love you a4tt, one of the few people with a sense of humour around here. You’ve also clearly learned a lot about football in the last years, for being a yank who picked up football like 10 years ago your opinions lately are actually better than like 95% of the forum :grimacing:

1 Like

:heart::heart::heart: u my dood :kissing_heart::kissing_heart:

I want to call this a circle jerk but I’m not sure if it requires more than two people to meet the definition.

2 Likes

It’s called pixelated 69’ing, or for all u gamers out there ERPing.

1 Like

Fascinating breakdown from Mourinho on his “masterclass” (Inter 3-1 Barcelona) back in 2010.

2 Likes

It does confirm that despite the genius of Xavi & co, these Barcelona team really were all about Messi.

You isolate him and it becomes a even match. Ofcourse it’s never easy to isolate Messi.

Another weird thing is Maxwell actually did better at attack and defence than Alves

Looking at last 5 and 10 years EPL stats for GF and GA averages by position… I only looked at top 7 because that is pretty much all that is relevant to us, but here it is:

Champions -

Avg10GF: 88.6
Avg5GF: 85.4
Avg10GA: 32.9
Avg5GA: 30.2

Second Place -

Avg10GF: 80.2
Avg5GF: 78.2
Avg10GA: 32.8
Avg5GA: 30.0

Third Place -

Avg10GF: 72.0
Avg5GF: 71.4
Avg10GA: 37.4
Avg5GA: 37.0

Fourth Place Trophy -

Avg10GF: 70.7
Avg5GF: 72.4
Avg10GA: 40.0
Avg5GA: 39.4

Euro Cup First Place -

Avg10GF: 63
Avg5GF: 63.8
AvgGA10: 44.8
AvgGA5: 44.2

Last Place in Europe -

Avg10GF: 59.0
Avg5GF: 60.8
Avg10GA: 44.3
Avg5GA: 44.6

Out of Europe First Place -

Avg10GF: 56.1
Avg5GF: 52.8
Avg10GA: 41.9
Avg5GA: 42.6

A few comments… the delta is light, but it would seem that goals at the very top are slightly down, both GF and GA… could just be variance noise but interesting to watch.

WRT Arsenal - our 73 goals for last season puts us just above the average for 3rd place for both last 5 and 10 year cohorts.

Our 51 goals against last 2 years is worse than the averages for position one through seven in both 5 and 10 year cohorts… by a decent margin. Would be interesting to see where it falls, but I am guessing around 9th - 11th.

73 goals for would line up with teams that finished: 3rd, 4th, 5th, 1st, 2nd (tied), 3rd, 3rd, 4th, 2nd, 4th

51 goals against would line up with teams that finished: 5th, 6th, 7th, 6th, 7th, 6th and 4 times out of the top 7.

2 Likes
1 Like

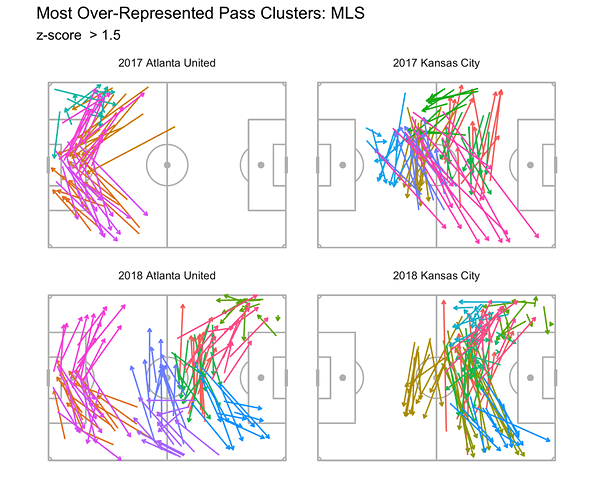
Not sure how to interpret… our map only shows one half of field… I can guess, but any explanation?

“This visualization combines the features of both pass network and touch heatmap. It shows what areas a team utilizes the most and how (what type of passes) it uses to access this zone. For example, last season, Atlanta used long horizontal passes to stretch the opponent while Kansas City camped outside the opponent’s box with its possession dominance. By plotting distinctive pass types this way, we can also see how a team evolves under a coach. For instance, Tata Martino had clearly instructed how Atlanta played out from the back, however, it was a work-in-progress in the first year. They got the build-up part right but had trouble transitioning into the attack. With another full season to practice, they exploded into one of the best offensive teams in MLS history in their second season.”

2 Likes

5 Likes

It means we pass along the back and two our fullbacks to much…

1 Like